All posts · Analytics
Five POS metrics for UK restaurant owners to review
Use these five measures to review a service and choose what to investigate. Compare them with a sensible baseline and your operating costs: sales growth alone does not establish profitability.
By Amaan Tanveer, Co-founder · · 4 min read
A small set of measures can make a service review easier. Check what each figure includes, compare similar shifts and ask what action the result suggests. A number is most useful when you understand its context.
The five that matter
- Net revenue: compare similar services and check what is deducted
- Average order value: review spend with prices and order mix
- Items per order: review basket depth alongside guest volume
- Top & bottom sellers: assess demand, margin and menu purpose
- Refunds: investigate the reasons behind repeated issues
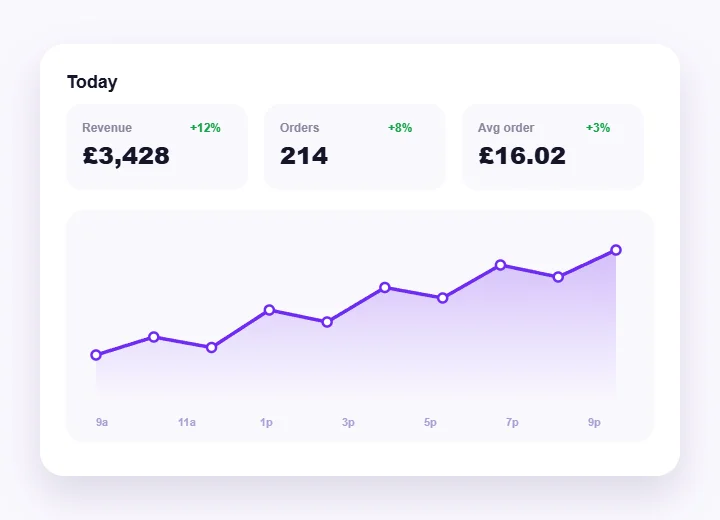
Act while it still matters
Use your reporting dashboard to review the figures while they are useful, checking when they last updated. A change in demand may prompt an availability check; a refund pattern may need a conversation with the team. Live cloud reporting needs a connection.
What good looks like, number by number
Net revenue needs a clear definition and baseline. Check how the report treats discounts, refunds and VAT, then compare similar days or shifts. Changes in opening hours, prices or guest volume can explain a difference; revenue alone does not show profit.
Average order value can change with pricing, menu mix, party size or guest choices. If you test a menu photo or staff prompt, compare similar services and review the result before assigning a cause. A higher ticket does not automatically mean a better margin.
Items per order measures basket depth. More covers can increase revenue even when items per order stays flat or falls. Read it alongside order volume, average order value and costs, rather than treating extra footfall as false growth or assuming the venue earned the same money.
Top and bottom sellers help you review demand. Check margin, waste, preparation effort and guest needs before promoting or removing a dish. A low-selling item may still serve a useful dietary or menu role. Clearer menu choices can also support the order handoff checks.
Refunds need reasons as well as amounts. Review repeated issues across comparable services, then check the underlying orders with the team. A small cluster is a prompt to investigate, not proof that a dish or member of staff caused a problem.
A weekly review of the same five measures
Once a week, compare revenue, average order value, items per order, sellers and refunds over a longer window. Check whether a new special added demand or shifted sales from another dish, and whether refund reasons repeat. Record the explanation and one action to test. Include ingredient, labour and other costs when judging profitability.
Use a current figure to ask a useful question during service, then review it against a comparable baseline before drawing a conclusion.
Servio provides basic reporting on every plan and advanced analytics on Growth; Starter can add advanced analytics for £25/month excluding VAT. Use the owner dashboard reports available to your plan for these reviews, and confirm the view and update timing you need. Our cost guide explains how reporting entitlements fit into a wider buying comparison.
Read volume figures in context
Lifetime sales, social followers and daily covers answer different questions. Covers rising while items per order falls can still mean higher revenue, depending on spend and order volume. Compare related measures and costs before calling a service better or worse. Keep the figures you can use to make a decision, rather than relying on one busy-looking number.
Connected sales records can make routine review easier, but keep definitions consistent when comparing reports. Use the POS figures alongside ingredient, labour and other cost records where needed. Decide who checks each measure and how an issue reaches the team, instead of relying on an assumed automatic alert.
Questions
Which POS numbers should an owner review?
Net revenue, average order value, items per order, top and bottom sellers, and refunds. Compare similar services and check the definitions. Review costs alongside sales before drawing conclusions about profitability.
Do I need a separate BI tool for this?
Start with the reporting available in your POS and a consistent review routine. Servio includes basic reporting on every plan and advanced analytics on Growth or as a Starter add-on. More detailed margin analysis may also need ingredient, labour and other cost records.
How often should owners check the dashboard?
Choose a routine that fits service: a glance after the first rush and before close, plus a weekly comparison. Check the data’s update time and investigate patterns rather than reacting to every small change.